


If you are looking to analyse stocks and shares in Excel then take a look at the Stock Data Type available in Excel 365. I wish this had existed 20 years ago when I used to have to copy and paste stock info in to Excel or we used to pay for online services to feed into Excel.
What is Stock Data Types in Excel?
The Data Types functionality let’s you insert the latest stock data directly into Excel. All the popular stock data fields used by analysts such as market cap, earnings, and beta, are all available plus many, many more.
There’s also Geographical data available, which let’s you insert the latest demographic and economic for any country but in this post we’re looking at the stock data.
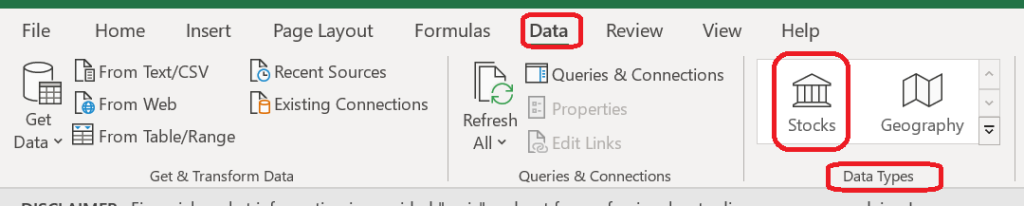
The stock data can be found under the Data ribbon, in the Data types column, see below.
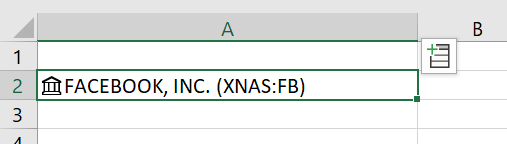
Excel will then put the selected company share in cell A2, and you’ll now see the Stocks symbol at the start of the cell and a data selector icon just to the top right of the cell – see below.
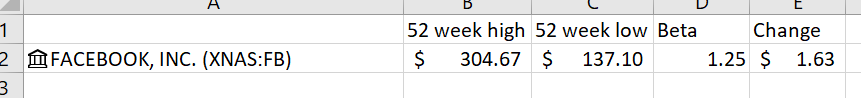
Click on this icon to see the data fields available for Facebook. Select the data point you are interested in and it will be added to cell B2. Select another data point and it will be added to cell C3, and so on, and so on.

It’s a good idea not to start in row 1, as you will need to enter the description of the data points you’ve added there to keep track of all the data, see below for what I mean.
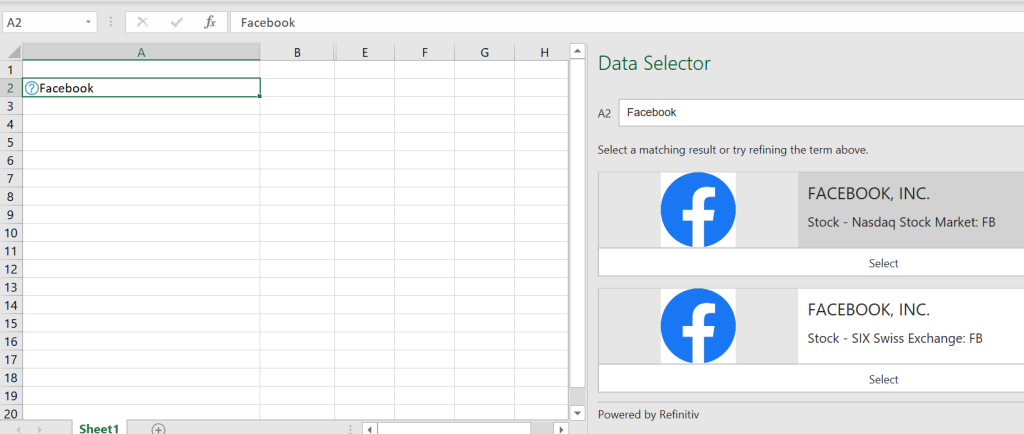
The easiest way to get started is to simply type in the name of a public company in cell A2 for example. Let’s try typing Facebook into cell A2 and click on the Stocks image (which looks like the front of a stock exchange, I guess) see below. As there are various Facebook classes of shares and listings, Excel will open a Data Selector window on the right-hand side and ask you to select the Facebook stock you are interested in (the top one of the main listing – Nasdaq – in this example).
You now have the data fields to build much more complex models.
Note: The Stocks and Geography data types are only available to Worldwide Multi-Tenant clients (standard Microsoft 365 accounts).
Which data points are available?
Where does the Stock data come from?
Fundamental company data, historical data, real-time and delayed prices, fund summary and performance data are provided by Refinitiv.
Please note the Disclaimer below from Microsoft – don’t use the data for trading purposes.

Prices are real-time for all trades executed on Nasdaq exchanges. Prices are delayed for all trades executed on other exchanges. 52-week high and low values are calculated from close price data.
To refresh the data just go to Data > Refresh All or press Ctrl+Alt+F5.
Further Reading: If you’re looking for an easy way to get historical financial data then take a look at the STOCKHISTORY function.
Example Stock Table
Here’s a link to a simple stock/shares data selection I’ve put together from the UK’s FTSE100 – not all 100 companies are on there. It only took ten minutes to create. I simply copied a list of the company names from the internet, pasted all the company names in Excel and clicked on Stock. Excel then went down the list and searched for each company – for any that Excel wasn’t sure of I just selected the correct stock from the Data Selector.
Once you’ve selected the data field for the top company you can simply drag the formula down for the rest and Excel will insert the data.
Leave a Reply