


With the Salesforce Summer ’24 Release we can now summarise very complex data using Matrix Reports. Think of a Matrix Report as a simple Pivot Table you may already be familiar with in Excel of CRM Analytics.
The Matric Table allows you to sumarise large datasets with a few clicks. This helps you easily identify themes and insights across complex data. And you can still use totals and grand totals to get quickly see higher level trends.
Matrix Reports allow you to add two row-level and two-column level groups. And this includes formula rows and columns.
How To Use Matrix Report
You’ll be delighted to hear that getting started with MatricReports in Salesforce is very easy.
- Click on the Reports tab in Salesforce
- Create a new report or simply run an existing report
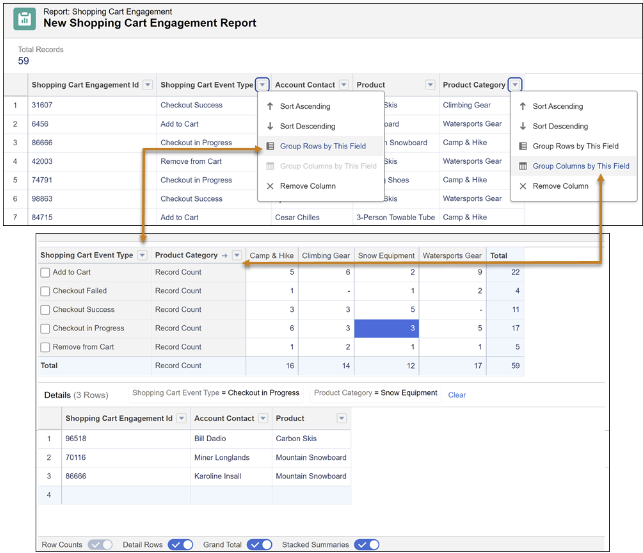
- From the report Run page, click the column actions icon next to a field name
- Select Groups Rows by This Field or Groups Columns by This Field.
It works like a simple Pivot Table you may already be familiar with in Excel or in CRM Analytics. See image below.
Leave a Reply