


When creating tables in CRM Analytics Widgets and Lenses, it’s possible to add Totals to rows and columns – it’s just not always obvious where to do this for CRMA newbies, or even for experienced developers. It’s tucked away a bit.
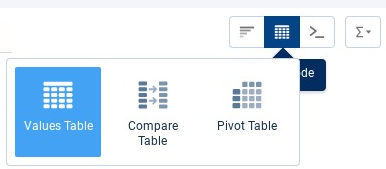
First, create a Lens or Widget. By default, you will be presented with a Chart. Click on the options up towards the top right-hand corner of the screen. If you select Table, you will be presented with three options:
- Values Table
- Compare Table
- Pivot Table
When you select one of these tables you’ll notice a new box to the right appear, which looks like the below:

This new box is the Totals selector.
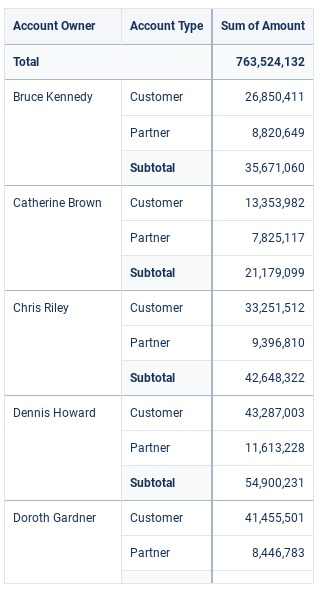
When on a Values Table you’ll get the option to ‘Show Totals’
When on a Compare Table you’ll get the option to ‘Show Totals’ and/or ‘Show Subtotals’
When on a Pivot Table you’ll get the option to ‘Show Column Totals’ and/or ‘Show Row Totals’
Totals appear at the top of the top, Subtotals appear at the bottom of each grouping – this position can’t be changed. It would be nice to have Totals at the bottom but hey-ho.
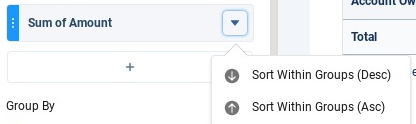
Bonus: remember that once you have sorted your data by Groups then Groups can be ordered in Ascending or Descending Order. To do this click on the upside-down arrow to the end of the Measure you want to sort by – see below. Next, select whether you want to sort groups ascending or descending.
Here’s a link to the Salesforce documentation for details of adding totals to tables on CRM Analytics – Table Properties (salesforce.com)
Leave a Reply