


Are you looking for a very quick and very easy way to show data visualisations in Excel? Then take a look at Data Bars from the Home ribbon.
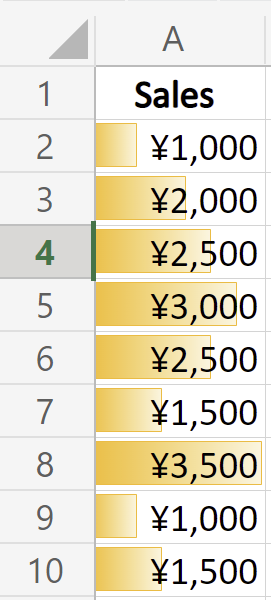
Data Bars quickly create bar charts based on the data in the range of cells you select.
And the datavisualisations are created right inside the cell, so no need to create your own graphs or charts separately.
To get started simply select the data range you want to visualise.
From the Home tab on Excel select Conditional Formatting, then select Data Bars.
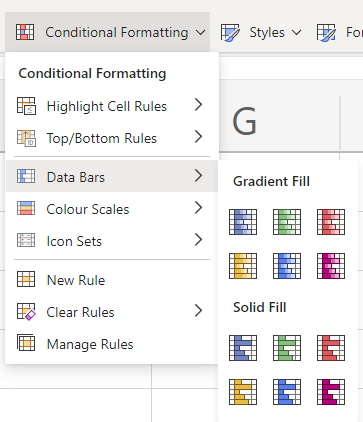
Next, you can quickly select the colour and opacity of the data bars. By opacity, I mean that you can select either a:
Gradient Fill
or a Sold Fill look.

Conclusion
Give Data Bars from Excel a try today. They are very simple and quick to create and look impressive on the page.
Leave a Reply